It started with a hunch—we knew something was off. Leads were coming in, but conversions were stalling. That’s when we turned to the lead generation metrics that reflect performance, not just activity.
Lead generation without tracking is a game of guesswork. Without the right lead generation metrics, you might hit the mark once in a while, but you’re usually just burning budget and time. The B2B sales cycle has evolved—it’s longer, more complex, and buyers expect relevance at every step.
At SalesAR, we have worked with over 500 companies across various industries. What was the one thing they all had in common? Gaps in their funnels that they didn’t even know existed—until they started measuring what mattered.
“Raw lead volume is just noise unless tied to real outcomes.We focus on clarity over vanity.”
Volume Isn’t Everything: Tracking Outreach Efficiency
You can send 10,000 emails and still feel like you’re shouting into the void.
High outreach volume might look impressive in a report, but it means very little without context. What matters is what those numbers tell you—and that’s where tracking the right lead generation metrics changes everything.
Let’s break down the three core metrics for lead generation that reveal the real story behind your outreach efforts:
Open Rate
The open rate is one of the most crucial metrics for lead generation. If no one’s opening your email, it doesn’t matter what you’re offering inside. This metric reflects how compelling your subject line is, how recognizable your sender name looks, and how “clean” your domain reputation is.
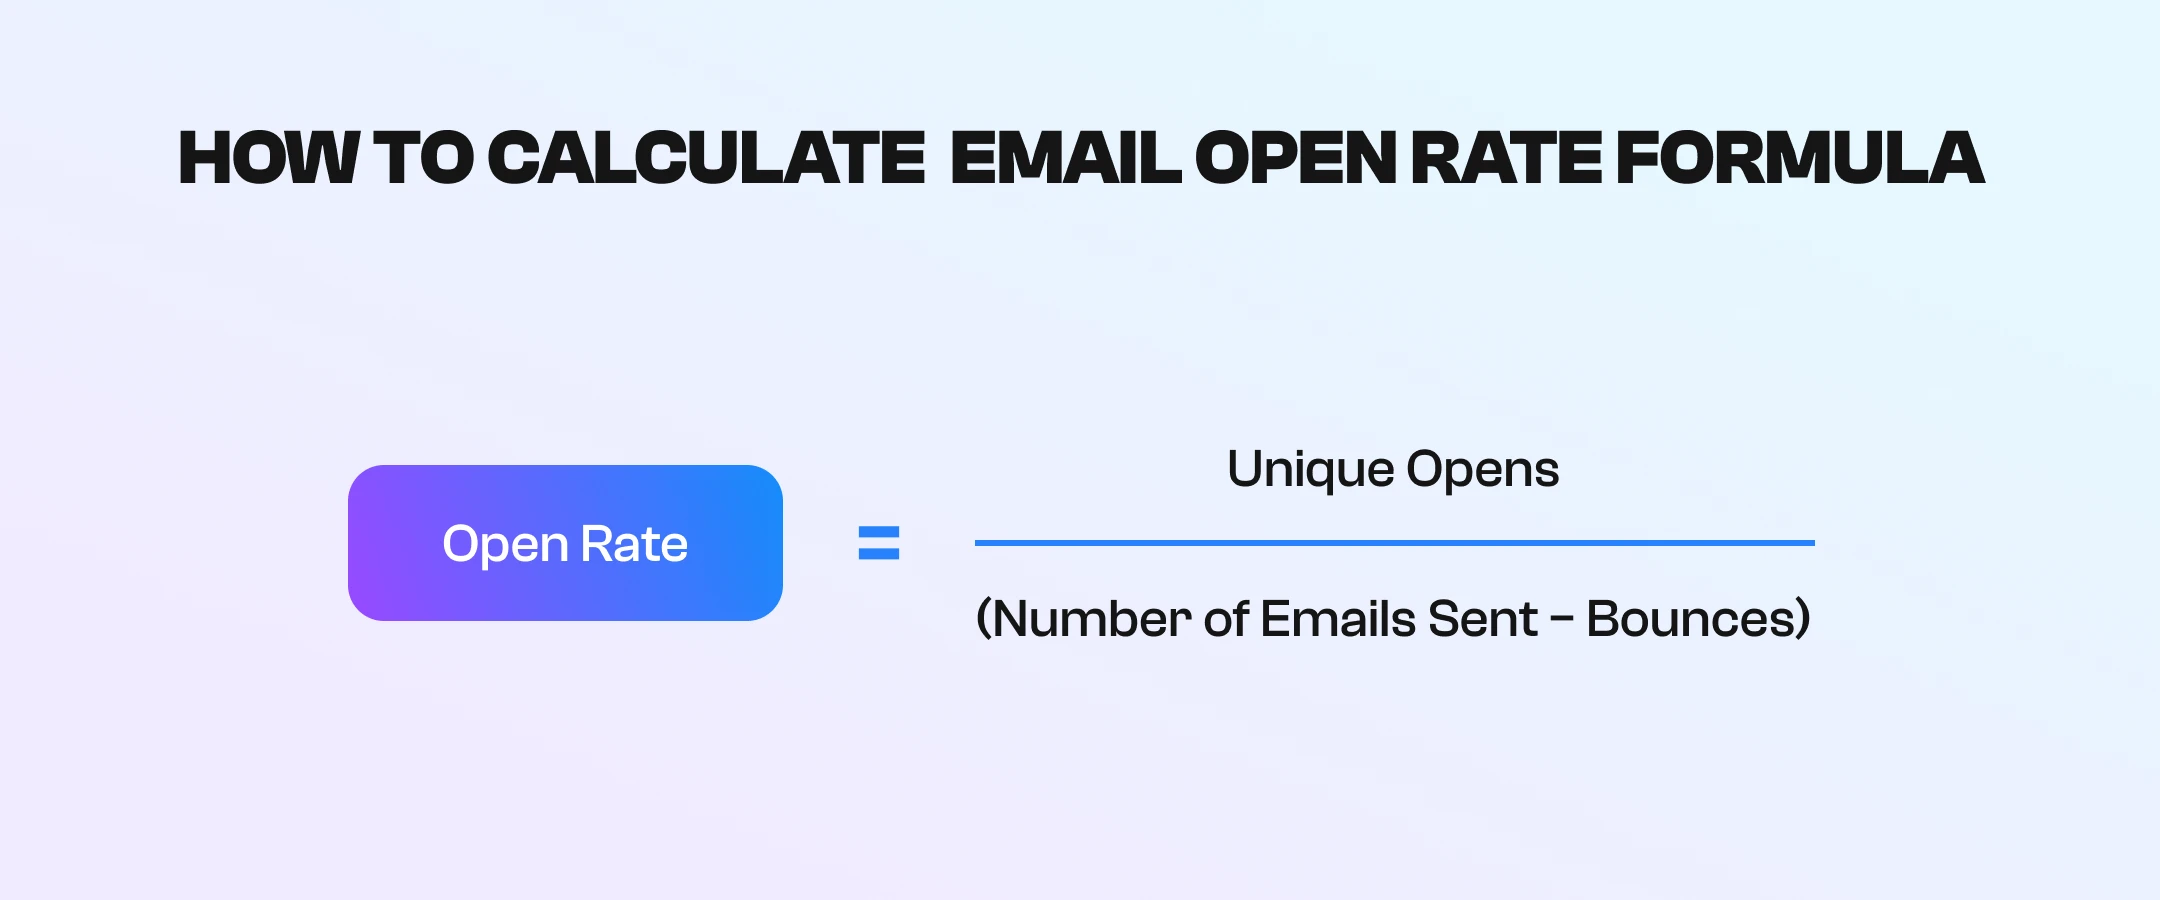
Low open rates often stem from technical or creative issues. Perhaps your subject lines resemble spam, filters may flag your emails, or your sending reputation has taken a hit because of bounces or too much activity in a short timeframe. Since open rate is one of the key lead generation metrics, it’s crucial to monitor and optimize it continually.
AI tools can automatically A/B test subject lines, track deliverability issues, and predict which subject line performs best for a specific persona. That’s a huge edge when you’re dealing with thousands of contacts.
Open rate tells you whether you’ve earned your reader’s attention. Without it, the rest don’t even get a chance.
Reply Rate
This is where the real conversation begins—or doesn’t. A low reply rate often indicates that your offer isn’t resonating. Even if someone opens your email, that doesn’t mean they’ll care enough to respond. As one of the core metrics for lead generation, reply rate reveals how effectively your message drives engagement and interest, making it essential for assessing campaign performance.
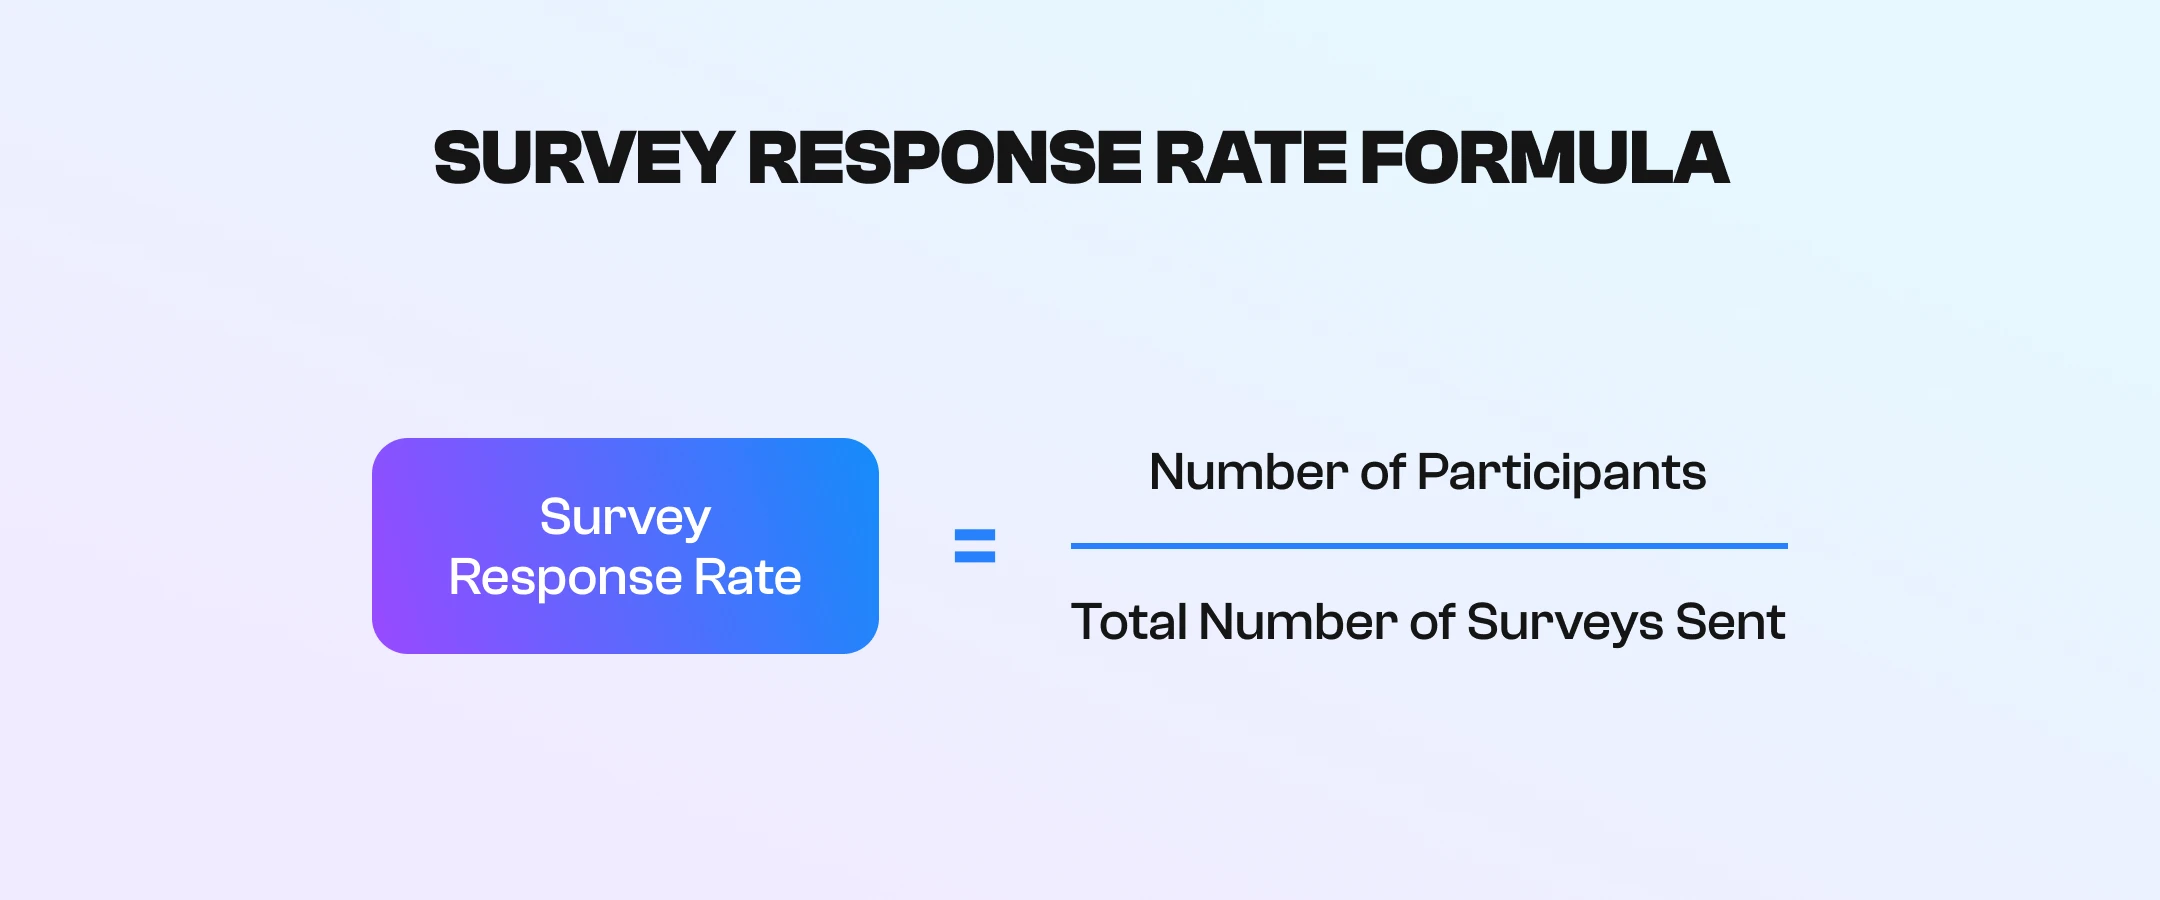
The reply rate provides feedback on the relevance and value to the person reading it. As one of the key lead generation metrics, it helps you understand how well your message resonates. If you’re seeing consistent opens but minimal replies, that’s your cue to look at your copy, CTA, and targeting.v
AI can help here, too. It identifies which message variants get responses and analyzes sentiment from replies to adjust future outreach. You stop operating on assumptions and start refining your approach based on actual human reactions.
A decent reply rate? Typically, 5–10% in most cold outreach efforts. Anything higher than that means you’re doing something very right.
Bounce Rate
This one doesn’t get talked about enough, but it has a massive impact on your entire campaign.
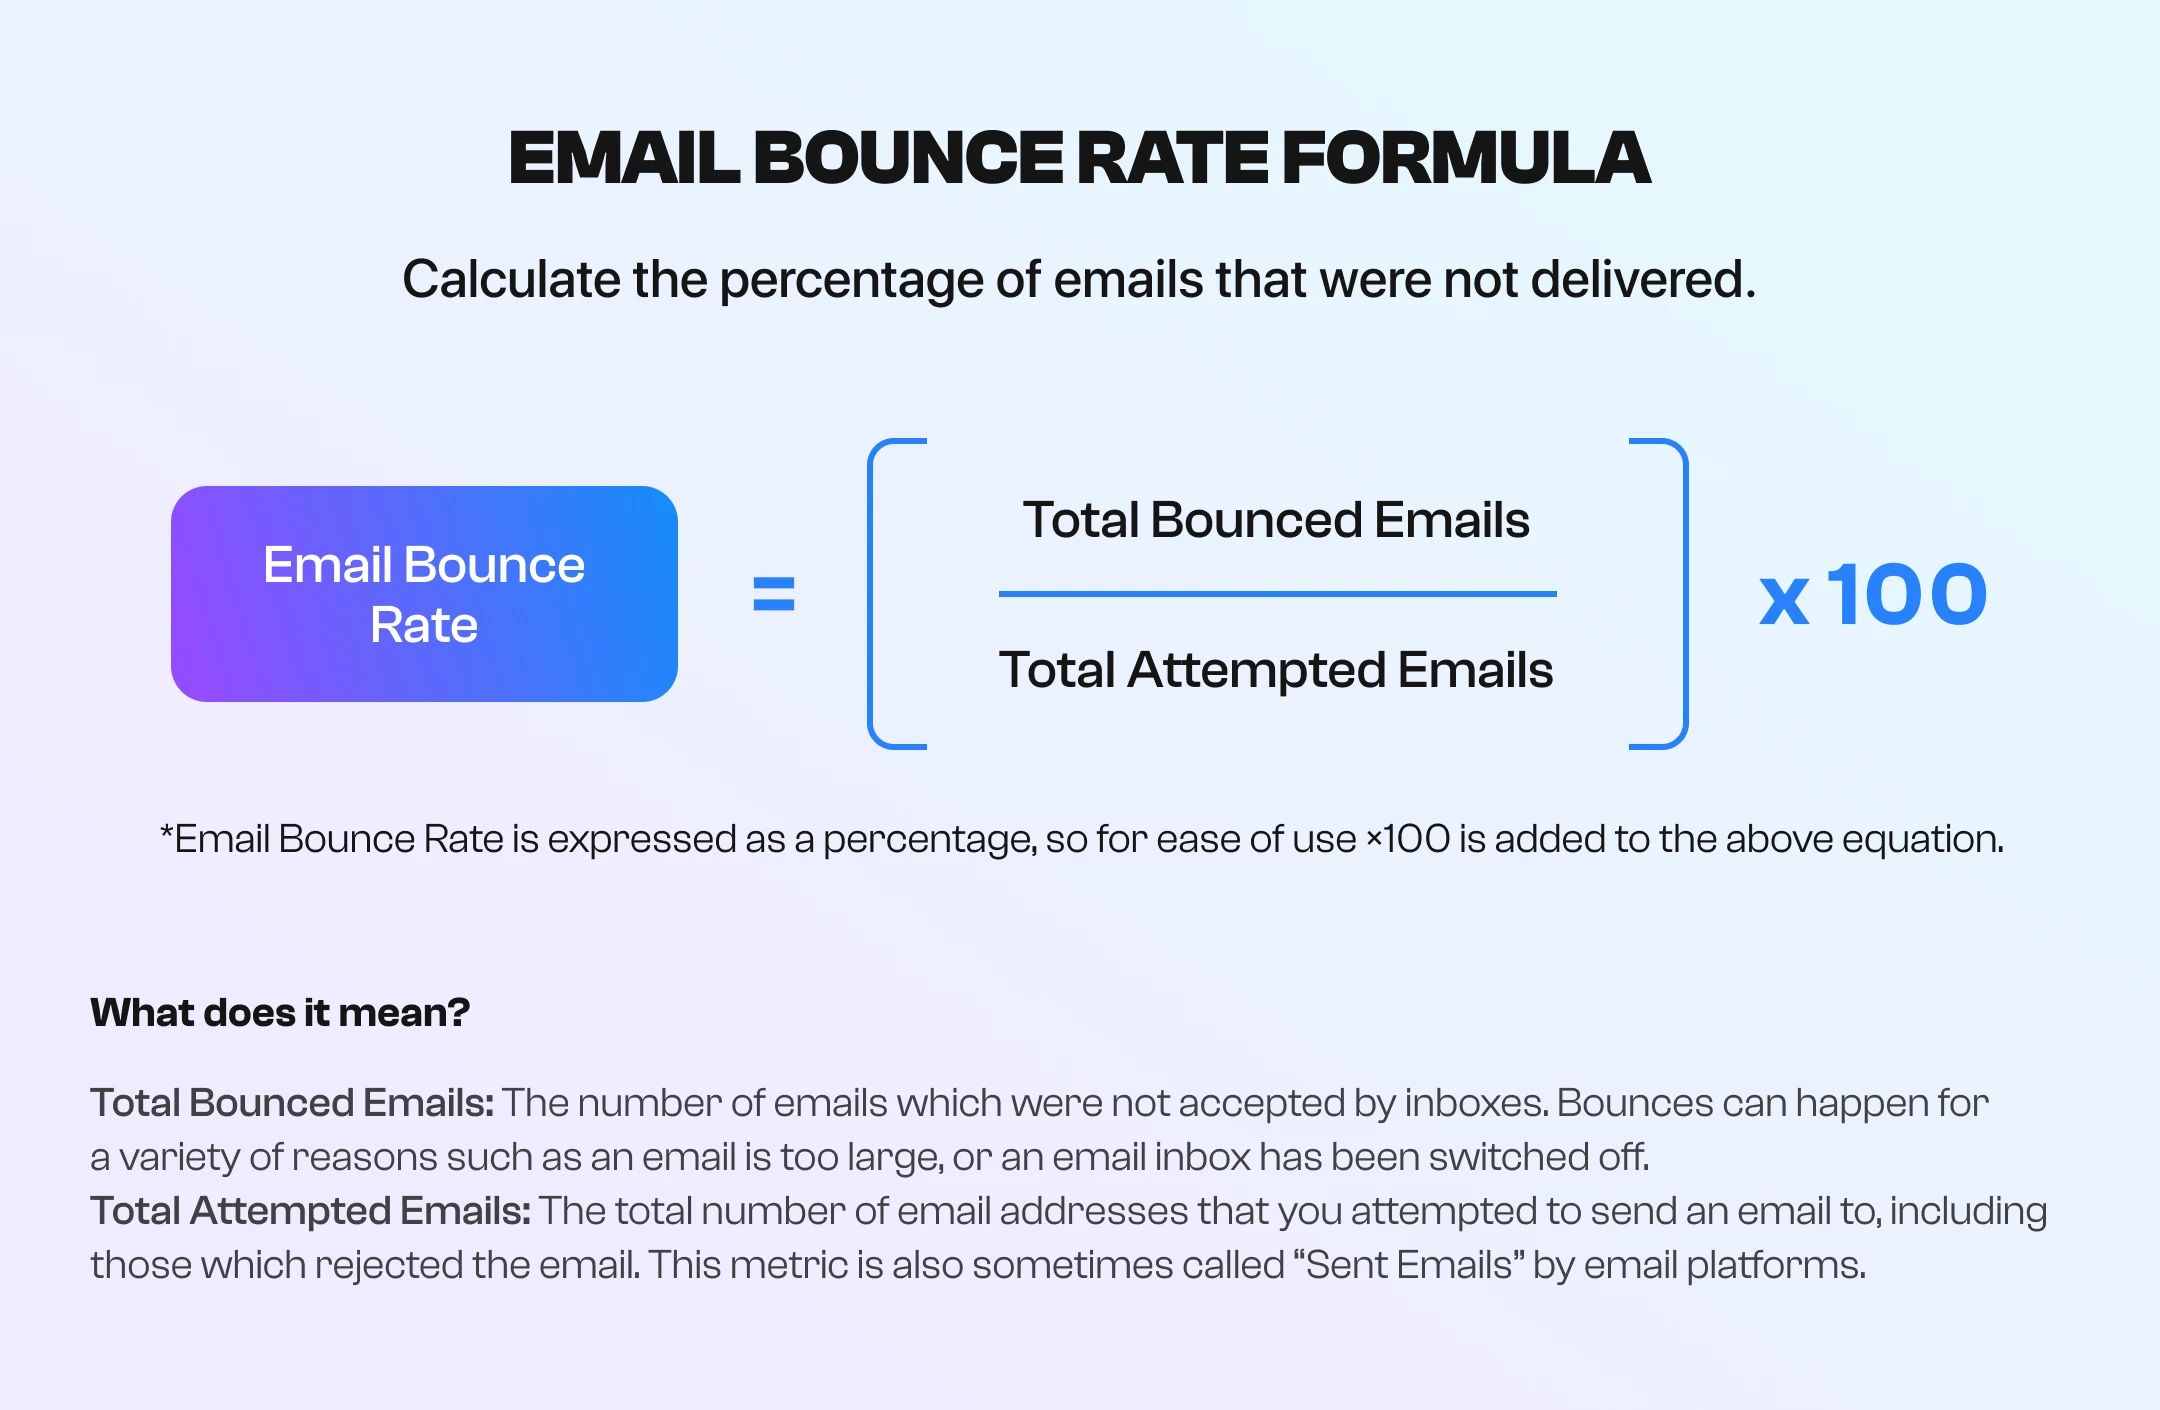
Bounce rate tracks how many of your emails don’t reach their destination. A high bounce rate indicates that your contact data is outdated or of low quality. But the bigger problem? Every bounce chips away at your sender reputation, affecting everything else—from inbox placement to domain trustworthiness.
Once email providers start marking you as suspicious, even your best content won’t get through. That’s why bounce rate is one of the lead generation performance metrics you can’t ignore.
AI helps by automatically cleaning lists, verifying emails in real-time, and flagging high-risk contacts before they hurt your performance. Some systems even score leads based on quality signals, so you’re not wasting time and damaging your reputation with bad data.
Think of bounce rate like silent sabotage. If you’re not tracking it, you won’t know you have a problem until your entire campaign tanks. It’s not just about delivery—it’s a foundational metric for lead generation success.
Here’s the reality: The industry average open rate for cold emails is about 21%. Reply rates? Usually under 10%.
So if your numbers are lower, don’t just send more. Fix what’s broken first.
From Replies to Revenue: Qualifying Lead Quality
It’s easy to get excited by a wave of responses, but not all replies are equal. Some are tire-kickers. Some are bots. Some just want to be removed from the list. The real win? Figuring out who’s interested—and who’s just noise. Tracking lead quality is one of the most crucial lead generation metrics because it differentiates between vanity metrics and actual revenue.
Lead Quality Score
Volume doesn’t pay the bills—qualified leads do. That’s why we focus on assigning a lead quality score to every reply. This score is based on factors such as company size, industry relevance, the seniority of the contact, and the lead’s alignment with your Ideal Customer Profile (ICP). These insights are essential lead generation campaign metrics, helping you evaluate not just how many leads you generate, but how many of them are actually worth pursuing.
AI makes this fast and scalable. Instead of sifting through replies manually, smart systems can assess the context, match against your target criteria, and score each lead in real time. The result? Your team knows exactly where to focus.
Lead quality scores don’t just help your SDRs—they also benefit marketing. You learn which campaigns generated quality leads and which merely filled your inbox with fluff. As part of your broader lead generation metrics, these scores offer visibility into what’s driving pipeline growth versus what’s just making noise.
Positive Reply Rate – Filtering Real Intent vs. Noise
A positive reply rate indicates the percentage of your total responses from individuals genuinely interested in having a conversation. It’s your best indicator of message-market fit.
We’ve seen campaigns where 10% reply, but only 1% show real intent. That’s a red flag. Either the offer’s unclear, or it’s landing in front of the wrong people.
By categorizing replies with the help of AI (e.g., “interested,” “not now,” “wrong person,” “unsubscribe”), you quickly filter out the noise. You’ll stop wasting time chasing dead ends and start putting energy into leads that might close.
Sales Accepted Leads (SALs)
This is where marketing and sales finally meet. SALs are leads that the sales team agrees are worth pursuing. They are not just warm contacts or polite replies—actual, vetted opportunities that align with your ICP and have shown interest.
Why do we love this metric so much? It’s one of the most actionable lead generation metrics—a clear signal that your efforts produce leads with real potential, not just noise. It bridges the gap between marketing activity and sales outcomes, helping both teams stay aligned on what success looks like.
“SAL is our favorite KPI. It’s the clearest signal that marketing and sales are rowing in the same direction.”
When your SAL count increases, it means two things: your targeting is effective, and your messaging resonates with your audience. It’s the handshake between your outreach and your pipeline.
At SalesAR, we track SALs closely because they bridge the gap between reply volume and revenue. They turn “looks good on paper” into “ready to close.”
Cost, Time, and Results: Financial KPIs That Matter
One of our SaaS clients reduced its cost per lead (CPL) by half without adjusting its ad budget. No flashy new campaign. No viral content. Just a smarter qualification. They stopped flooding the funnel with low-quality leads and started targeting accounts with real potential. That slight shift at the top of the funnel rippled down, saving money, closing deals faster, and keeping the sales team focused on what mattered.
When evaluating success, lead generation performance metrics like CPL, conversion rates, and pipeline velocity keep you grounded. They help you cut through vanity metrics and see what drives growth. And when you visualize those insights in a lead generation metrics dashboard, it becomes even easier to align teams, optimize efforts, and track what your CFO cares about.
Cost Per Lead (CPL)
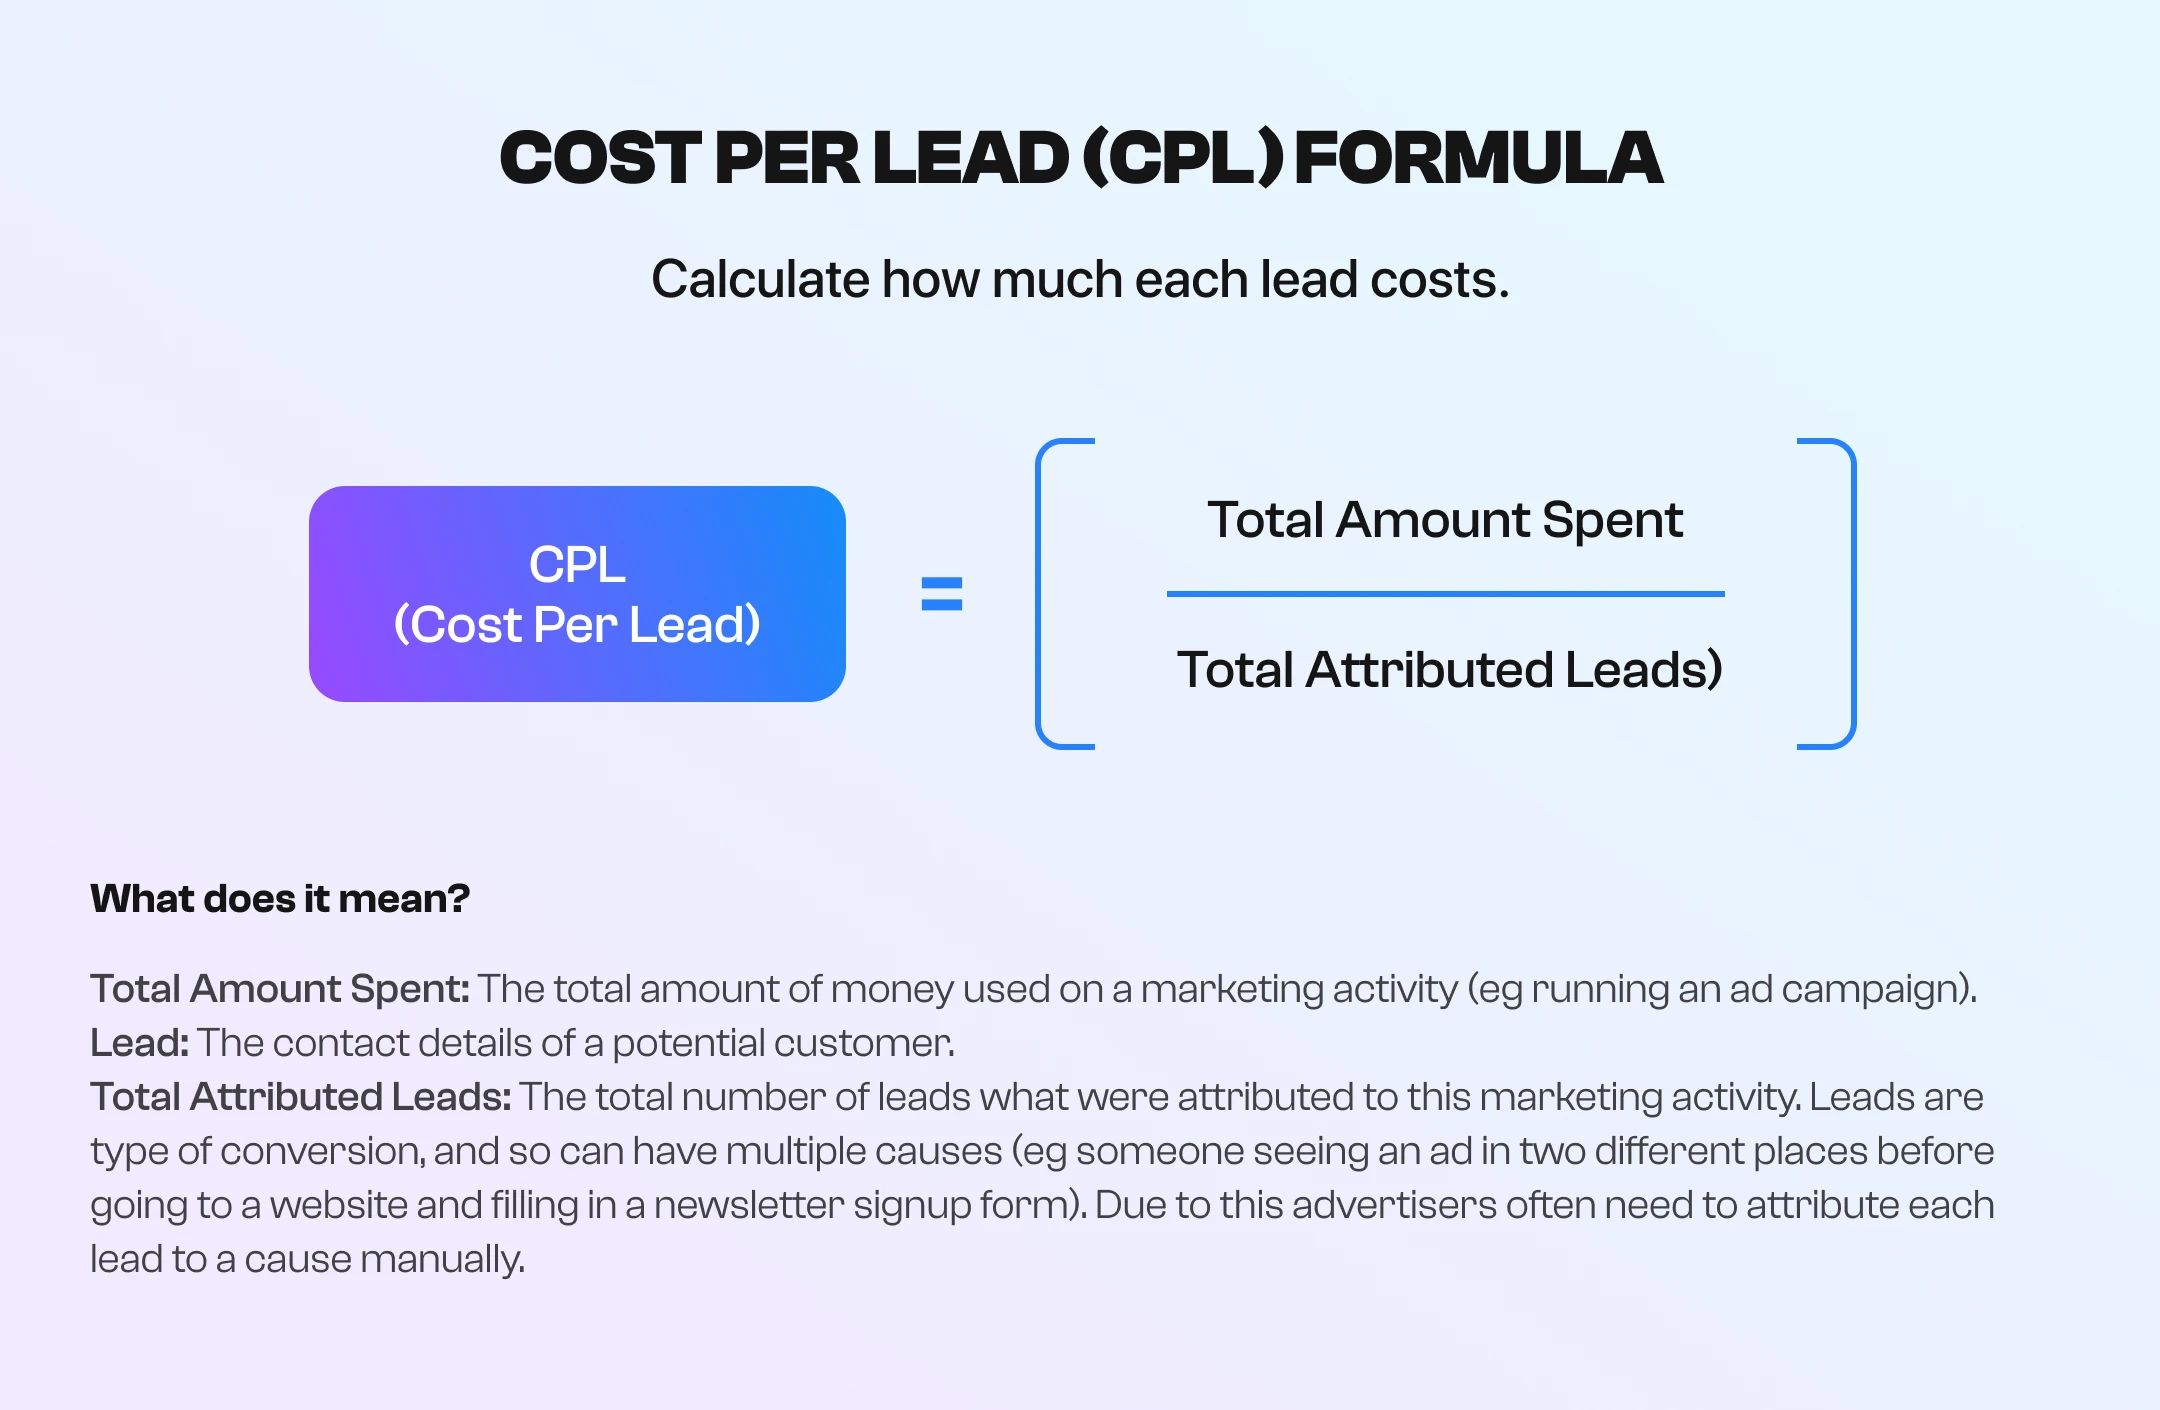
CPL tells you how much you spend to bring a lead into your pipeline. And while it’s often treated as a bragging point (“Look how low our CPL is!”). The real story is a bit more nuanced.
- Paid ads (Google, LinkedIn, Meta, etc.)
- SDR salaries or outsourced lead-gen services
- Prospecting tools and software
- AI platforms used for targeting, enrichment, or scoring
- Creative assets, landing pages, and content creation
A low CPL is only worth celebrating if the leads are qualified and relevant. Otherwise, you’re just filling the funnel with noise.
- Filters low-quality leads before they reach a human
- Uses data to predict which accounts are most likely to convert
- Helps personalize messaging at scale, improving reply rates
Track Cost Per Lead (CPL) by channel and campaign. A $30 lead from a niche webinar may outperform a $10 lead from a broad LinkedIn campaign when you look further down the funnel.
Customer Acquisition Cost (CAC)
CAC zooms out. It tells you the total cost of turning a lead into a customer. This includes everything—marketing, sales, tech, and sometimes even onboarding.
- All CPL components
- SDR and AE time to nurture and close
- CRM and automation tools
- Sales enablement content and assets
- Any outsourced support or consultants
- Account management in the early customer lifecycle
If your CAC is rising, it’s not always a marketing issue. Sometimes the problem is inefficient follow-up, too many handoffs, or leads that never had real intent in the first place.
- Accelerates lead scoring and routing, so hot leads don’t go cold
- Provides SDRs and AEs with intel (firmographics, technographics, intent signals)
- Reduces time spent on unqualified accounts
- CAC for lower-tier plans (SMB) can range from $200–$800
- Mid-market and enterprise deals often hit $1,000–$2,500+ (Source: FirstPageSage, OpenView, ProfitWell)
High CAC isn’t always bad—if your Customer Lifetime Value (CLTV) justifies it. But if you’re paying more to acquire a customer than they’re worth in the long term, something’s off. AI can help spot that misalignment fast.
Don’t just cut budgets or chase cheaper clicks. Start by improving targeting, qualification, and follow-up timing—small shifts that drive big savings.
Tracking CPL and CAC isn’t just for finance. It’s how growth teams determine where to focus and where to stop wasting time. When paired with lead quality metrics and outreach efficiency, these numbers reveal everything you need to know about whether your pipeline is built for scale or merely busywork.
Return on Investment (ROI)
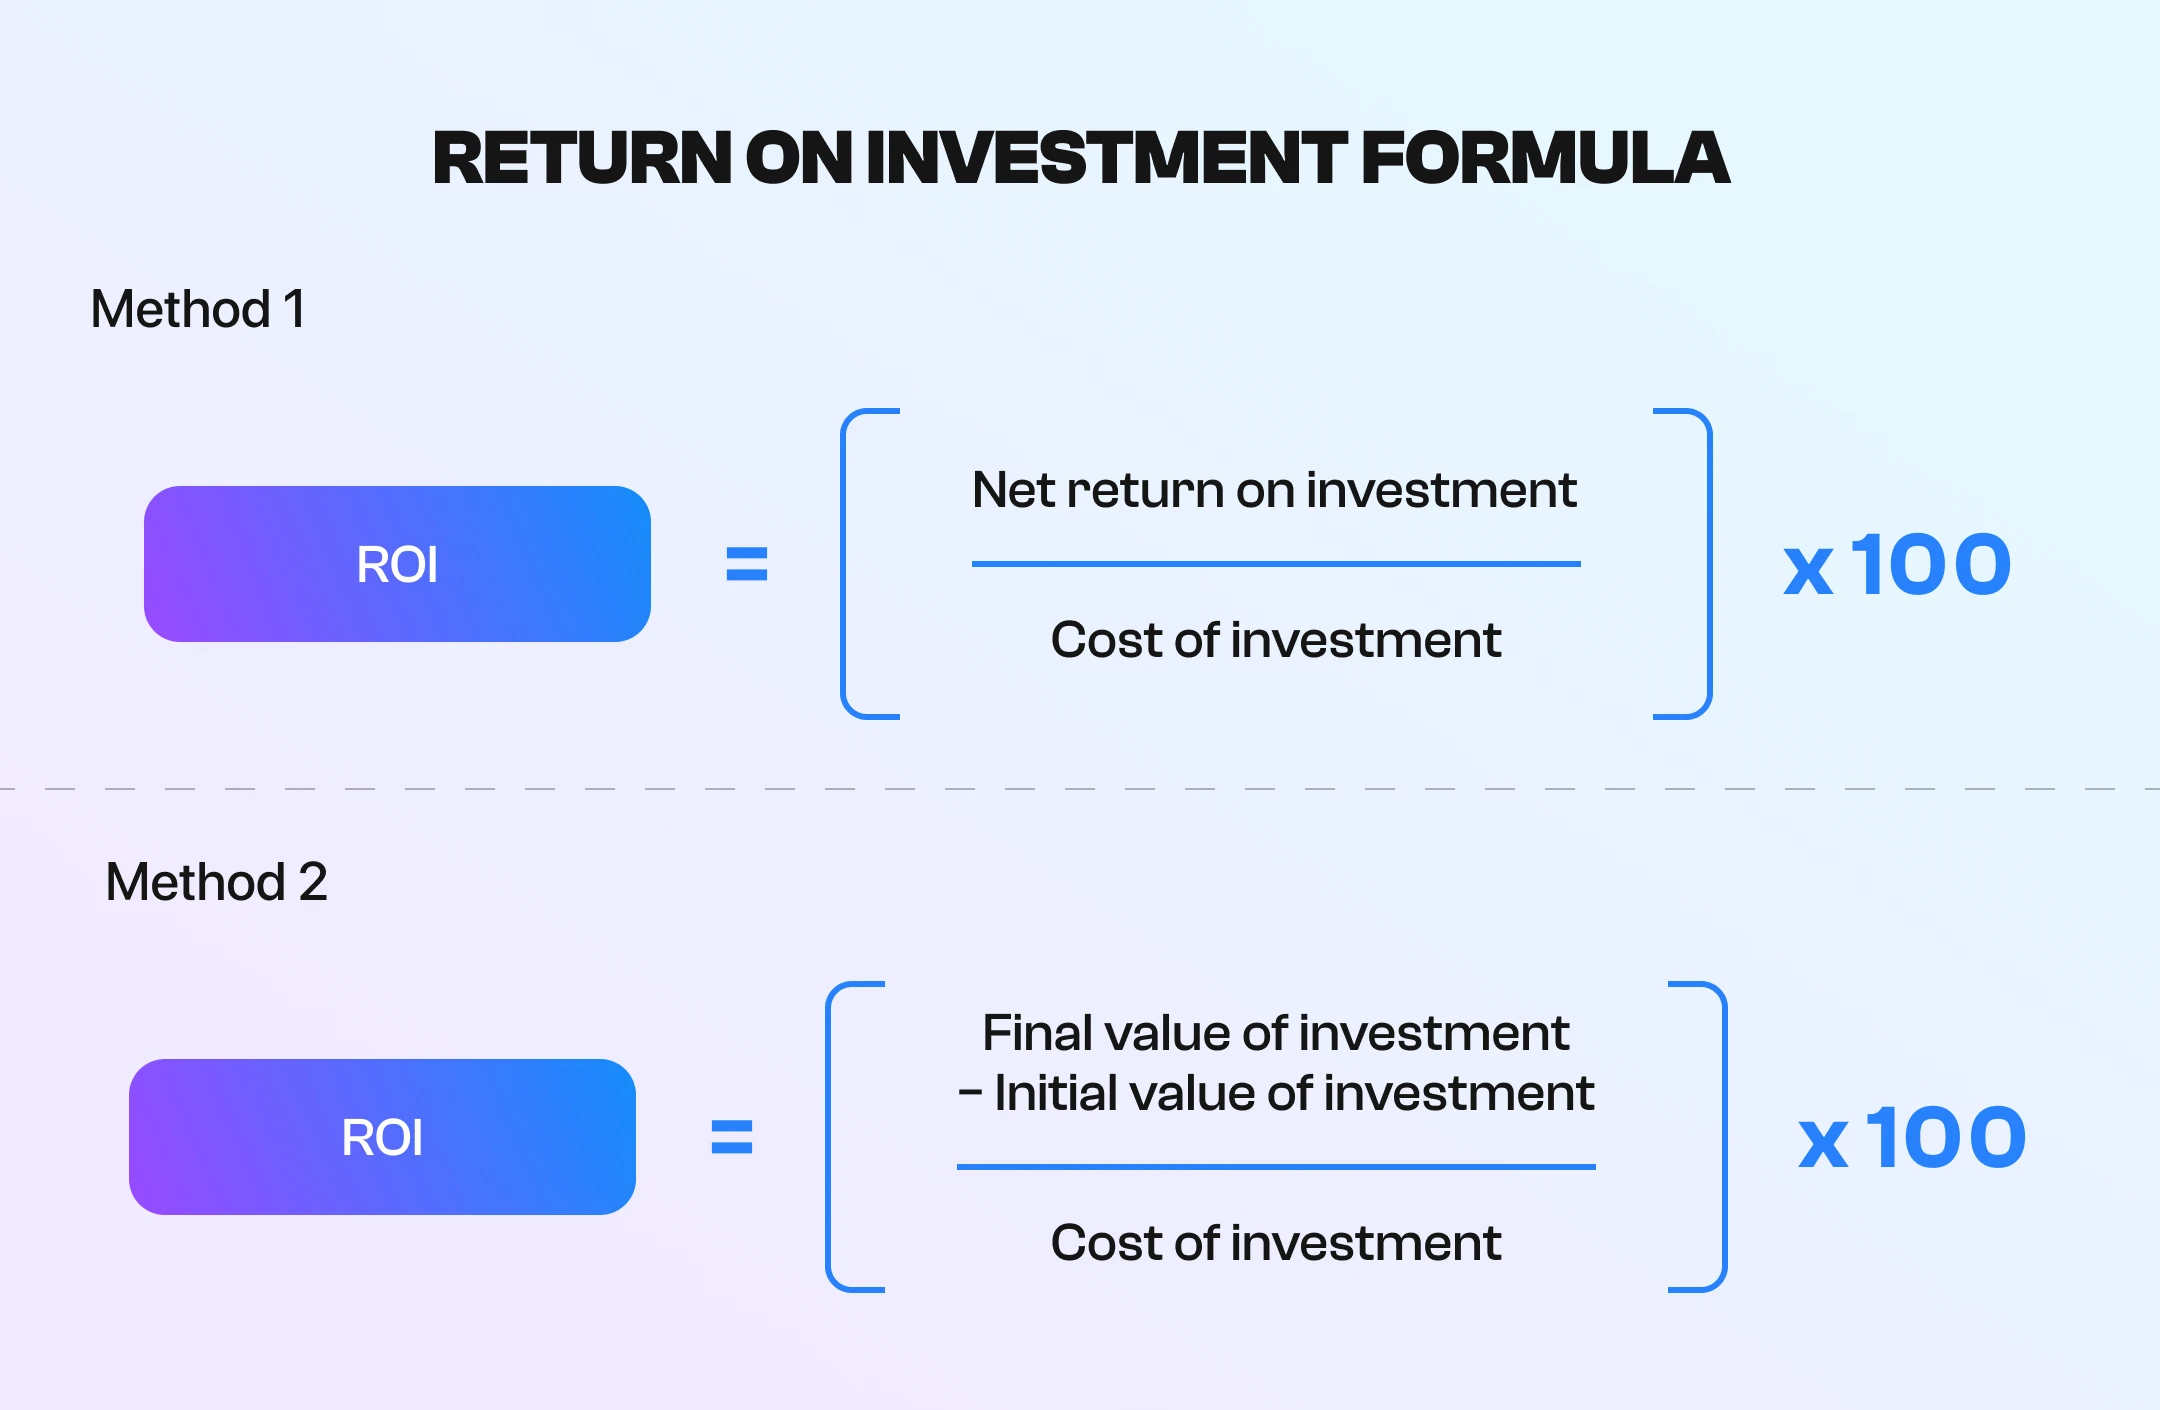
Every campaign, every email, every call comes down to one thing: did your lead generation campaign metrics show a return?
ROI is your north star. It tells you how much return you get for every dollar spent on lead generation. And it goes beyond just closed deals. A strong ROI also reflects how well your sales and marketing teams are aligned, how efficiently you qualify leads, and how scalable your process is.
Companies with mature lead generation programs see up to 20% higher ROI than those manually piecing things together.
That kind of lift doesn’t come from sending more emails. It comes from sending smarter ones to the right people, at the right time, with the right message. AI helps do all three.
- Predictive targeting that surfaces high-intent accounts
- Automated A/B testing to optimize messaging faster
- Lead scoring that prioritizes deals with the highest close potential
When ROI improves, you know the system is working, not just generating noise, but producing actual revenue outcomes.
SalesAR Case: 12x ROI After Recalibrating Outreach Messaging
One of our clients in the manufacturing and procurement software space (MPO) was getting replies, but not the right ones. The results were undeniable after recalibrating their outreach with targeted messaging, personalized angles, and strategic timing, backed by AI insights.
They achieved a 12x ROI on their campaign.
Want the full story? Read how we did it.
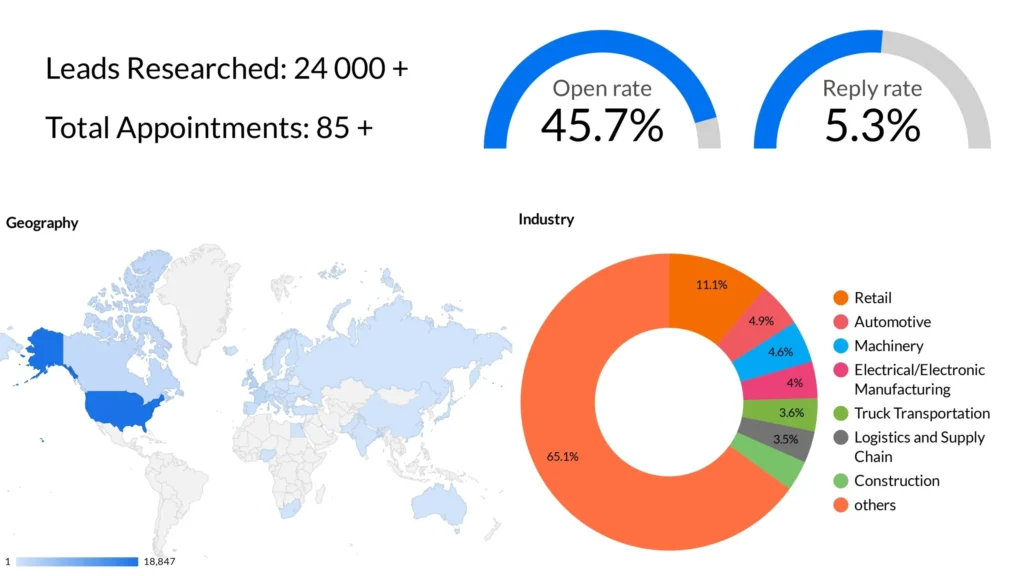
Client Testimonial: “Through the partnership with SalesAR, the company has received over 50 appointments and continues to aim for five each month. The team is highly communicative and leads a smooth collaboration. Customers can expect a knowledgeable team.”
It’s a clear example of how aligning your offer with the audience—and letting AI fine-tune your execution—can turn replies into real revenue.
The Operational Layer: What Slows You Down?
One of our best-performing campaigns almost exclusively generated qualified leads. Open rates were high, replies poured in, and the ICP was spot on. But something felt off.
Then we checked the timestamps: the average follow-up time from sales was 48 hours.
By the time reps reached out, the spark was gone. Leads had moved on, forgotten, or booked a meeting with a competitor who replied in under 10 minutes.
This is the operational layer—the behind-the-scenes stuff that doesn’t appear in flashy campaign reports but can quietly wreck your entire funnel. A lead generation metrics dashboard with response times and engagement speed can highlight these hidden bottlenecks, helping you fix them before they sink high-performing campaigns.
Lead Response Time – Speed = Interest Captured
Timing isn’t just a nice-to-have—it’s everything. The faster you respond to a lead, the more likely they will stay engaged.
Studies show that leads contacted within 1 hour are 7x more likely to qualify than those contacted after two hours. (Source: Harvard Business Review)
That’s not a fluke. It’s behavioral psychology. When someone responds to your outreach, they’re in the mindset. Wait too long; you’re just another message buried in their inbox.
AI helps automate early touchpoints, including instant replies, calendar links, and qualification questions. But automation alone isn’t enough. Your team needs systems to follow up fast, especially when the signals are hot.
Sales Cycle Length – Understanding Where Deals Stall
You’re getting leads. You’re booking calls. But then… deals stall.
This is where sales cycle length becomes critical. If it’s stretching longer than usual, it’s time to investigate:
- Are there too many handoffs between SDRs and AEs?
- Are prospects waiting for information that should have been sent earlier?
- Are we losing momentum because the pitch doesn’t address urgency?
AI tools can identify friction points in the cycle—where reps lose engagement, where deals go dark, and how long it takes from first contact to close. From there, you can plug the leaks.
Shorter cycles mean more deals per quarter, more accurate forecasting, and a tighter revenue engine.
Meeting Booked Rate
Everything you do—every click, open, reply—leads to one key moment: the booked meeting.
This is the metric that connects top-of-funnel activity to the actual pipeline. An excellent reply rate is worth celebrating if it results in qualified meetings.
- Clarity of the CTA in your messaging
- Speed and quality of follow-up
- Ease of scheduling (AI scheduling links help a lot)
- Intent and qualification process
If your meeting rate is low despite receiving positive replies, something is broken in the handoff. Either the SDR isn’t qualifying properly, or the follow-up feels canned and kills the vibe.
When we track this number closely, we don’t just improve conversion—we build momentum. Every booked meeting is a step closer to revenue, and it’s one of the clearest indicators that your outreach is creating real traction.
Bringing It All Together: The Power of Dashboards
In our early days, we tracked everything manually. Open rates, replies, leads—we lived in spreadsheets. It worked well enough, until it didn’t. Things began to slip through the cracks when we started scaling across multiple campaigns, clients, and SDRs. Metrics were outdated. Follow-ups got missed. And the insights came too late.
That’s when we built a lead generation metrics dashboard—one place to see what’s working, what’s breaking, and where to act in real time.
Dashboards aren’t just for data nerds. They give your team visibility at every level, so decisions don’t wait for weekly syncs or end-of-month reports.
Real-Time Visibility = Faster Decisions
When lead generation performance metrics are tracked in real time, you don’t waste days diagnosing problems. You see them as they happen, and you adjust on the fly.
Campaign falling flat? You’ll immediately notice the drop in open rates. Replies are up, but meetings are down? You’ll see where handoffs are failing. Bounce rate spiking? Time to clean the list.
It turns reactive troubleshooting into proactive growth. You go from playing catch-up to staying one step ahead.
What to Track at a Glance
A good dashboard keeps it simple. At a glance, you should be able to spot trends and take action. Here are some lead generation metrics examples we recommend putting front and center:
- Open Rate – Are your emails getting noticed?
- Reply Rate – Is your messaging resonating?
- Bounce Rate – Is your data hurting your deliverability?
- Positive Reply Rate – Are the right people engaging?
- Sales Accepted Leads (SALs) – Are sales and marketing aligned?
- CPL (Cost per Lead) – Is your outreach efficient?
- Meetings Booked – Are replies turning into honest conversations?
Track these across campaigns, SDRs, and channels to comprehensively view what’s driving results.
Recommended Tools
You don’t need to build a custom platform from scratch—there are plenty of tools that make this easy:
- HubSpot – Great for marketing and sales teams under one roof
- Salesforce – Enterprise-grade CRM with endless dashboard options
- Google Data Studio – Free, flexible, and perfect for visual reports
- Custom API Dashboards – Ideal if you need to connect multiple tools (email, CRM, LinkedIn, VOIP)
SalesAR Workflow Tip
At SalesAR, we build custom KPI boards for every client campaign. These dashboards consolidate data from cold emails, LinkedIn outreach, and call performance into a single view.
Why? Because lead generation isn’t just about a single channel anymore. You can make faster, smarter decisions when you can see how each part of your outreach feeds into the bigger picture. These dashboards highlight meaningful lead generation metrics examples—from open and reply rates to lead quality scores and conversion timelines—that help teams focus on what drives results.
That’s the real value: turning data into action.
Conclusion
KPIs won’t do the work for you. They won’t write the email, call, or close the deal. However, they will show you where to look, what to fix, and what to focus on. They cut through gut feelings and give you absolute clarity—the kind that turns outreach into revenue.
If your funnel isn’t converting as it should, the answer is usually in the data. You just need to know where to look.
So, here’s a question to leave you with: What’s your most ignored metric?
Start there. That number holds more power than you think.
Want a live breakdown of your lead generation funnel? Book a call with SalesAR. Let’s identify the gaps, address what’s slowing you down, and establish a pipeline that performs.

